Cluster point map
Groups points defined by latitude and longitude on a map.
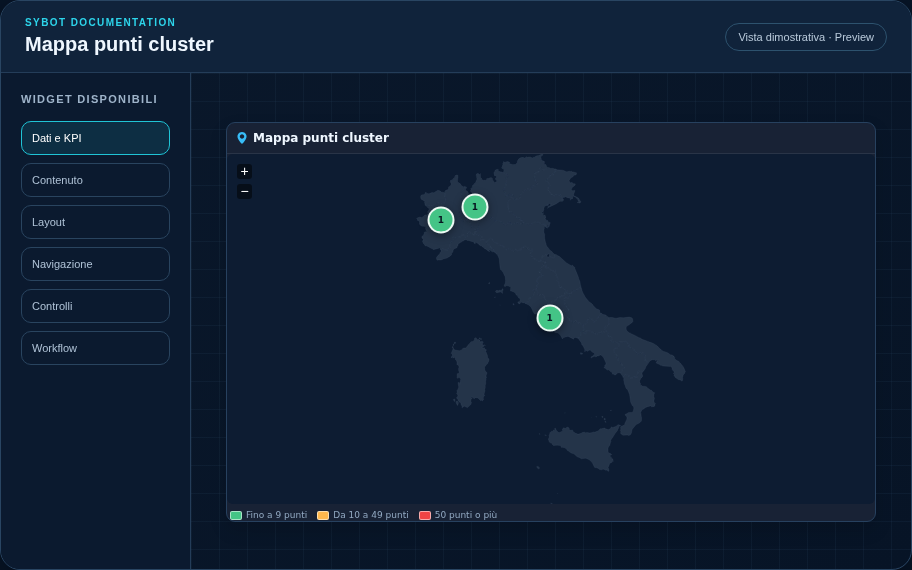
Recommended configuration
- Associate a source and select the Latitude and Longitude columns.
- Select the map scope and, optionally, a descriptive column for the point.
- Configure cluster radius and colour thresholds, then check zoom and grouping in Preview.
Configuration options
| Area | Options |
|---|---|
| Map | Map scope, latitude and longitude columns, point label and grouping radius. |
| Thresholds | Ranges, labels and colours used to distinguish cluster counts. |
| Identity | Title, Subtitle, header visibility, type icon and actions button. |
| Presentation | Standard, Compact or Dense variant and message to show when no data is available. |
| Appearance | Background, background image, border, radius, padding, shadow and typography for different areas. |
| Position | Coordinates and dimensions in cells within the page or container grid. |
Best practices
- Use WGS84 decimal coordinates: latitude between -90 and 90, longitude between -180 and 180.
- Clusters are automatically recalculated during zoom and resizing.
tip
Always verify the widget in Preview, in both light and dark themes, and with an empty data state before publishing the view.