Choropleth map
Colour geographical areas based on an aggregated value.
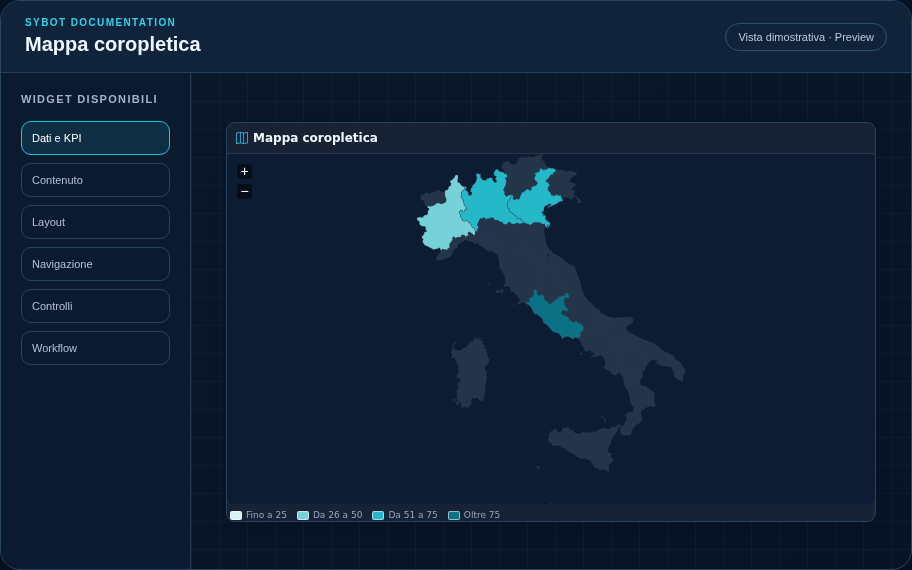
Recommended configuration
- Associate a source and select the geographical key, value and aggregation.
- Use the World, Europe or Italian regions presets; for other perimeters, paste a GeoJSON FeatureCollection.
- Define thresholds and colours and verify the correspondence between data keys and areas in Preview.
Configuration options
| Area | Options |
|---|---|
| Map | Cartographic scope, area key, value, aggregation and colour thresholds. |
| GeoJSON | Custom FeatureCollection and property that identifies the same area present in the data. |
| Identity | Title, Subtitle, header visibility, type icon and actions button. |
| Presentation | Standard, Compact or Dense variant and message to show when no data is available. |
| Appearance | Background, background image, border, radius, padding, shadow and typography for different areas. |
| Position | Coordinates and dimensions in cells within the page or container grid. |
Best practices
- Presets recognise both map codes and area names.
- For custom GeoJSON, specify the property that contains the same key present in the data.
tip
Always verify the widget in Preview, in both light and dark themes, and with an empty data state before publishing the View.