KPI
Displays a single value or an aggregation from the source.
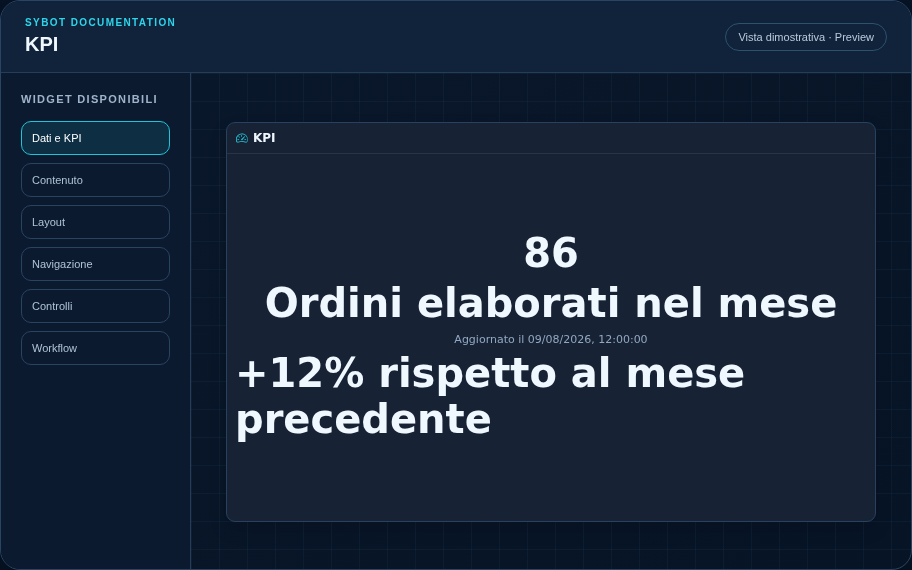
Recommended configuration
- Associate a data source and select the column to display.
- Optionally choose Sum, Average, Minimum, Maximum, or Count.
- Configure format, units, comparison, and visibility of the last update date.
Configuration options
| Area | Options |
|---|---|
| Data | Source, column to display, and aggregation: first row, sum, average, minimum, maximum, or count. |
| Value | Format, decimals, units, caption, comparison, secondary value, status, and text for zero. |
| Update | Visibility of the date and time of the last received update. |
| Identity | Title, Subtitle, header visibility, type icon, and action button. |
| Presentation | Standard, Compact, or Dense variant and message to show when no data is available. |
| Appearance | Background, background image, border, radius, padding, shadow, and typography for different areas. |
| Position | Coordinates and dimensions in cells within the page or container grid. |
Best practices
- Without aggregation, the value of the first returned row is displayed.
tip
Always verify the widget in Preview, in both light and dark themes, and with an empty data state before publishing the View.