Gauge KPI
Displays a KPI against a configurable maximum value.
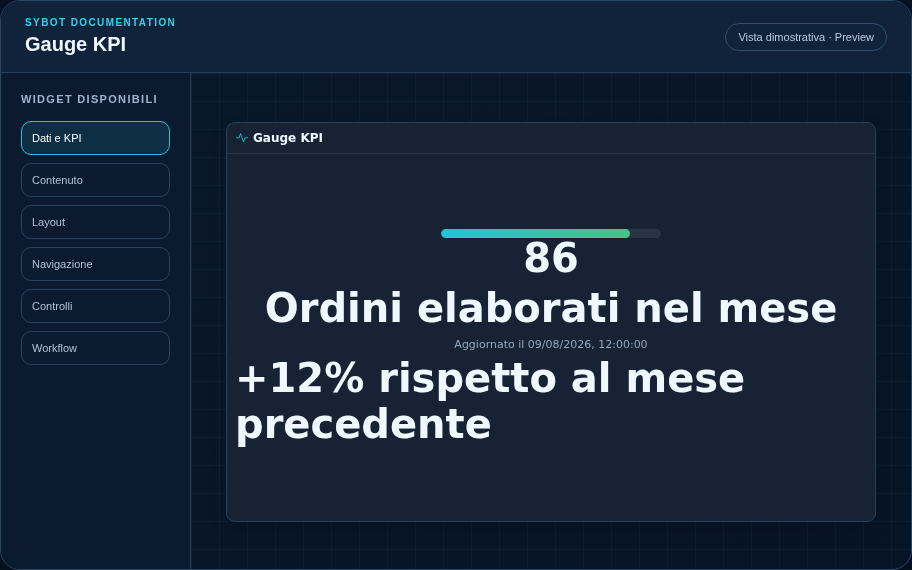
Recommended configuration
- Associate the source, select the column and any aggregation.
- Set the Maximum value to use as the gauge reference.
- Check format, unit and result via the widget preview.
Configuration options
| Area | Options |
|---|---|
| Data | Source, column to display and aggregation: first row, sum, average, minimum, maximum or count. |
| Value | Format, decimals, unit, caption, comparison, secondary value, status and text for zero. |
| Update | Visibility of the date and time of the last update received. |
| Gauge | Maximum value used as the visual reference for the indicator. |
| Identity | Title, Subtitle, header visibility, type icon and actions button. |
| Presentation | Standard, Compact or Dense variant and message to show when no data is available. |
| Appearance | Background, background image, border, radius, padding, shadow and typography for different areas. |
| Position | Coordinates and dimensions in cells on the page or container grid. |
Best practices
- The maximum must be positive and consistent with the value unit.
tip
Always verify the widget in Preview, in both light and dark themes, and with a no-data state before publishing the View.