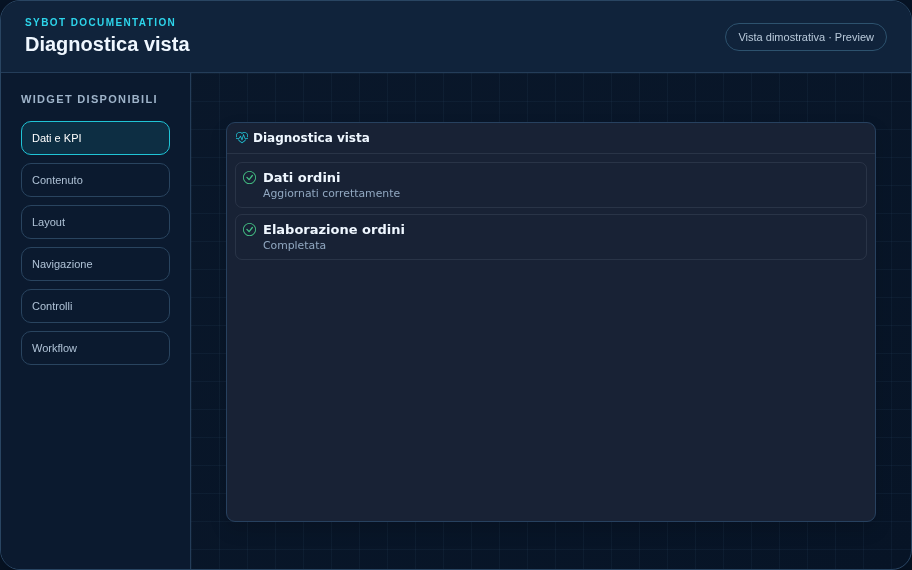
View Diagnostics
Summarises the status of data sources and page operations.
Recommended configuration
- Place the widget in a dedicated panel or Drawer.
- Select which control families to include.
- Check ready, running, empty, and failed states.
Configuration options
| Area | Options |
|---|---|
| Diagnostics | Inclusion of data source status, Workflow operations, and regular states. |
| Identity | Title, Subtitle, header visibility, type icon, and actions button. |
| Presentation | Standard, Compact, or Dense variant and message to show when no data is available. |
| Appearance | Background, background image, border, radius, padding, shadow, and typography for different areas. |
| Position | Coordinates and dimensions in cells within the page or container grid. |
Best practices
- Diagnostics displays safe messages and correlation codes, not sensitive details.
tip
Always check the widget in Preview, in both light and dark themes, and with an empty state before publishing the View.