Logs - Execution Explorer
The Logs - Execution Explorer page is dedicated to viewing and analysing workflow executions recorded by the platform.
The page allows you to analyse:
- workflow executions
- execution states
- produced results
- used parameters
- execution durations
- nested workflows and parallel branches
- details of tasks executed within a specific execution, including status, output, and operational information
- JSON details of the run or individual tasks
The page is divided into a search and filter section for executions, a list containing the executions to which you have access, and a dedicated area for viewing the details of the selected execution.
For each execution, you can view general information, input parameters, executed workflows and tasks, the status and outcome of each processed element, any errors detected during execution, and the JSON details of the data recorded by the platform.
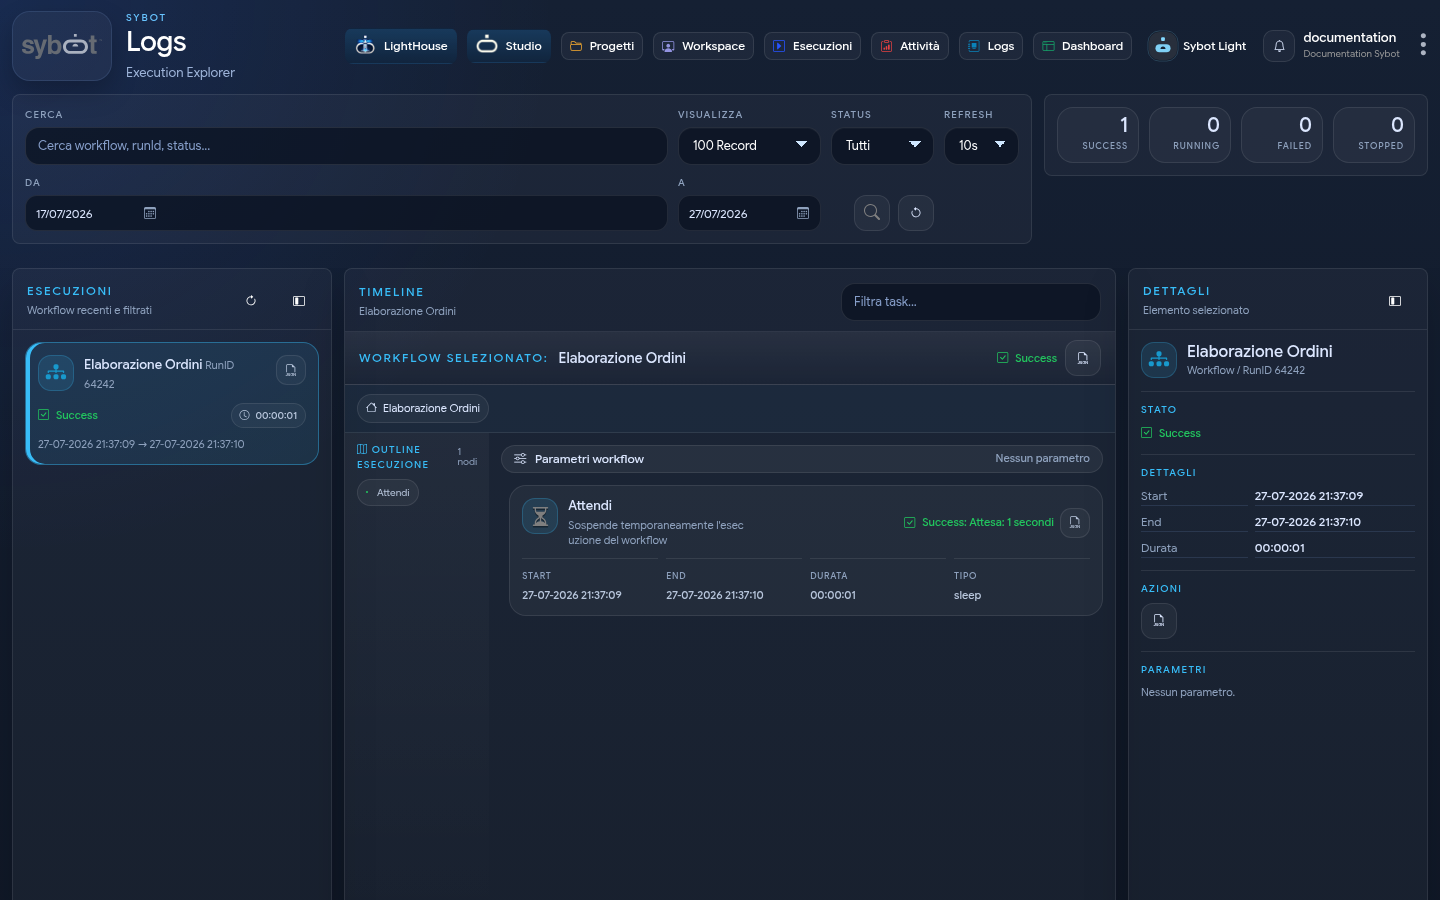
1. Filter Section
The filter section is located at the top of the page and allows you to limit the list of displayed executions.
The available filters enable you to quickly locate a specific execution or a set of executions consistent with the set criteria.
1.1 Global Search
The global search field (marked with the name 'Search') allows you to search for executions using free text.
The search can be applied to information such as:
- Workflow name
- RunId (execution identifier)
- Execution status
The field allows you to narrow down the list of executions and facilitates the identification of the execution to be analysed.
1.2 Result Limit
The View filter allows you to define the maximum number of records loaded into the EXECUTIONS - Recent and filtered workflows list.
The available options allow you to view 10, 100, 1000, or all executions matching the set search criteria.
1.3 Status Filter
The Status filter allows you to view only executions that match the selected states.
The options are:
- All
- Running
- Success
- Warning
- Failed
- Stopped
The filter allows you to focus on specific operational conditions, such as correctly completed executions, failed executions, interrupted workflows, or workflows still in progress.
1.4 Auto Refresh
The Refresh filter defines the frequency of automatic updates of the information displayed on the page.
Automatic refresh updates data related to executions and tasks, with particular utility when monitoring workflows in Running state.
1.5 Search Period
The From and To fields allow you to limit log viewing to a specific time interval.
The set period is applied to the search for executions recorded by the platform.
1.6 Applying and Resetting Filters
The section provides the actions necessary to apply or remove the configured search criteria.
The following operations are available:
- Apply: to update the list of executions based on the set filters.
- Reset: to restore the default values of the filters and display the complete list of executions again.
2. Execution Summary - KPI Cards
The summary section shows a quantitative synthesis of the executions identified by the applied search criteria.
Executions are aggregated by state.
The summarised states are:
- Success
- Running
- Failed
- Stopped
Each indicator shows the number of executions present in the corresponding state.
The summary represents the overall distribution of execution states returned by the search and is not influenced by the Status filter, which acts exclusively on the list of displayed executions.
3. Execution List
The Executions - Recent and Filtered Workflows section displays the list of available executions based on the applied filters.
Each card represents a single workflow execution.
For each execution, the following main information is displayed:
- workflow name
- RunID
- execution status
- start date and time
- end date and time
- duration
- access to detailed JSON
Selecting a card updates the central timeline and the details panel with information related to the selected execution.
3.1 Execution Status
The status identifies the current condition or final outcome of the workflow.
The following statuses are available:
- Running: the workflow is currently executing.
- Success: the workflow has correctly completed all planned activities.
- Failed: the execution terminated due to an error that prevented completion.
- Stopped: the execution was manually interrupted by the user from the Executions page or directly from the Designer.
- Warning: the execution terminated via a Workflow Exit task configured to return a warning status. For more information, consult the documentation for the Workflow Exit task.
3.2 Execution ResultJSON
Each execution card exposes an action to open the execution's detailed JSON.
This JSON represents the result of a workflow execution. It contains:
- execution metadata (run_info)
- parameters received by the workflow (parameters)
- list of executed tasks (tasks)
- any child workflows executed via Run Workflow tasks (result_target_workflow)
- final outputs produced by tasks (output_parameters)
For example:
{
  "run_info": {
    "status": "Completed",
    "run_result": "Success"
  },
  "output_parameters": {
    "exitStatus": "0"
  }
}
3.3 Live Update
Executions in Running status are updated based on the frequency defined by the automatic refresh.
4. Execution Timeline
The Timeline section represents the central analysis area for the selected run.
The timeline shows the sequence of elements that make up the workflow execution, including tasks, parameters, statuses, execution times, and nested workflows.
The timeline is updated based on the run selected in the execution list.
4.1 Selected Execution
The timeline header displays the currently selected workflow and its status.
For the selected execution, operational information is available in the DETAILS section, such as:
- workflow name
- execution status
- start date and time
- end date and time
- duration
- access to the execution's Result JSON
- workflow input parameters
4.2 Workflow Parameters
The Workflow Parameters section displays the input parameters associated with the selected execution, if defined by the workflow configuration.
For each parameter, a card is displayed containing:
- Parameter name
- Parameter type
- Value used in the execution, where available.
Parameters of various types may be present, including text, numeric, date, list of values, file, and encrypt.
File type parameters are represented via three distinct parameters:
nome_parametro.filenome_parametro.filenamenome_parametro.content
For Encrypt type parameters, the value is not exposed for security reasons; only the name and type of the parameter are shown.
The section allows verification of the parameters actually associated with the run and reconstruction of the workflow execution context.
4.3 Task Filter
The Filter tasks field allows filtering of the elements present in the timeline.
The filter enables locating specific tasks within executions with many nodes.
The search acts on the elements shown in the timeline of the selected run.
4.4 Executed Tasks
The timeline shows the tasks executed during the execution of a workflow.
Each task is represented with a dedicated card.
For each task, the following operational details are available:
- task name
- description or brief detail
- task status
- start date and time
- end date and time
- duration
- task type
- RunID (if the task executed a workflow)
- associated parameters
- execution result
- access to the Result JSON of the single task execution
Task statuses allow you to identify the result produced by each individual node of the workflow.
4.5 Task Details
Selecting a task updates the details sidebar panel.
The task details display the information associated with the selected item, including status, timings, command/result, and available actions.
For tasks that produce a result, the details allow access to the information generated during execution.
4.6 Task Actions
Task cards expose the available actions for the selected item.
Actions may include:
- opening the JSON
- downloading available results
- copying the command, where applicable by task type
- accessing the details of the nested workflow, when the task launches another workflow
The displayed actions depend on the task type and the data produced by the execution.
4.7 Nested Workflows
The timeline supports the display of nested workflows executed within a main run.
A nested workflow is shown as an internal element of the timeline and maintains its own execution information, including status, duration, parameters, and tasks.
When a nested workflow is opened in focus mode, the timeline switches to the level of the selected workflow.
4.8 Navigating Between Nested Workflows
Consulting nested workflows occurs through the hierarchical structure of executions.
You can navigate between different levels using:
- the path displayed under Workflow in focus, which shows the hierarchy of parent and child workflows and allows direct access to each level of the execution chain;
- the Execution Outline panel, which displays the tree of activities and invoked workflows;
- tasks capable of executing workflows (for example: Run Workflow) allow you to view the details of the child workflow execution.
When a workflow executes another workflow, the relative execution is displayed as a nested level of the timeline, allowing you to analyse the details of the executed activities without losing the context of the parent workflow.
This navigation mode allows you to explore complex workflows composed of multiple execution levels while always keeping the relationship between parent and child workflows visible.
4.8.1 Execution Outline
The section indicated as Execution Outline shows a synthetic representation of the nodes present in the timeline.
The outline allows you to move quickly between:
- executed tasks
- nested workflows
- tasks executed in nested workflows
Each element of the outline represents a node of the selected execution.
4.9 Parallel Branches
When the workflow uses Parallel Branches and Sync Branches, the timeline keeps the execution structure visible:
- Parallel Branches represents the group of concurrent paths;
- Branch identifies each selected path;
- Sync Branches shows the synchronization point;
- Continuation represents the common continuation after the Sync;
- Task shows the individual activities executed within the branches.
For each level, status, start and end time, duration, and a summary of tasks are available. Expansion controls allow you to compress or open the nested content.
Focus mode temporarily isolates the selected group, branch, or Sync. The path at the top allows you to return to previous levels without losing the context of the main execution.
If a branch task has been executed more than once, the card can display its corresponding Attempt count. Review the latest attempt and compare it with previous ones to distinguish a definitive error from a subsequently completed execution.
The Execution Outline also includes parallel groups, branches, synchronization points, and continuations, enabling you to reach a node quickly even in complex or nested diagrams.
5. Details Panel
The Details panel is located on the right side of the page and displays information about the selected item.
The panel updates based on the selection made in the executions list, timeline, or outline.
Selectable items include:
- workflow
- task
- nested workflows
- parallel groups and branches
- synchronization points and continuations
5.1 Workflow Details
When an execution is selected, the panel displays the main information for the run.
Available information includes:
- workflow name
- RunID
- status
- start date and time
- end date and time
- duration
- run parameters
- available actions
5.2 Task Details
When a task is selected, the panel displays the operational information for the selected task.
Available information includes:
- task status
- execution details
- command / result
- available actions
5.3 Nested Workflow Details
When a nested workflow is selected, the panel displays information about the internal execution.
The available information allows you to distinguish the nested workflow from the main run and analyse its execution status.
5.4 Parallel Branch Details
By selecting a group, branch, or Sync, the panel displays the available operational information for that item: status, timings, duration, number of tasks, and attempts.
This view enables you to compare branches without consulting environment configuration information.
6. Error Analysis
The page allows you to identify the overall status of a run and the status of individual tasks.
In case of a failed execution, the timeline enables you to identify the failing task and the point in the sequence where the workflow stopped.
The details panel and the JSON of the selected item provide the available operational information for execution analysis.
For a structured verification:
- check the overall status of the run;
- identify the first failing task in the timeline;
- open the Details panel and read the displayed message;
- if parallel branches are present, also verify the status and attempts of the other branches;
- consult the JSON only if the summary is insufficient.
When it is necessary to involve an administrator, communicate the workflow name, execution date and time, and the relevant identifier. Do not copy passwords, tokens, or other sensitive values.