Knowledge Graph
The Knowledge Graph tab makes entities and relationships recognised in LightHouse documents explorable. Every item shown derives from accessible documentary evidence: the graph helps to discover connections, while the documents remain the source to verify.
1. Choose the scope
In the Graph scope field you can select:
- All accessible knowledge, for a cross-section view of the Library;
- a single collection, to limit nodes, relationships and evidence to the documents in the collection.
The global view does not extend permissions. Two users can therefore see different graphs based on the documents and collections they can consult.
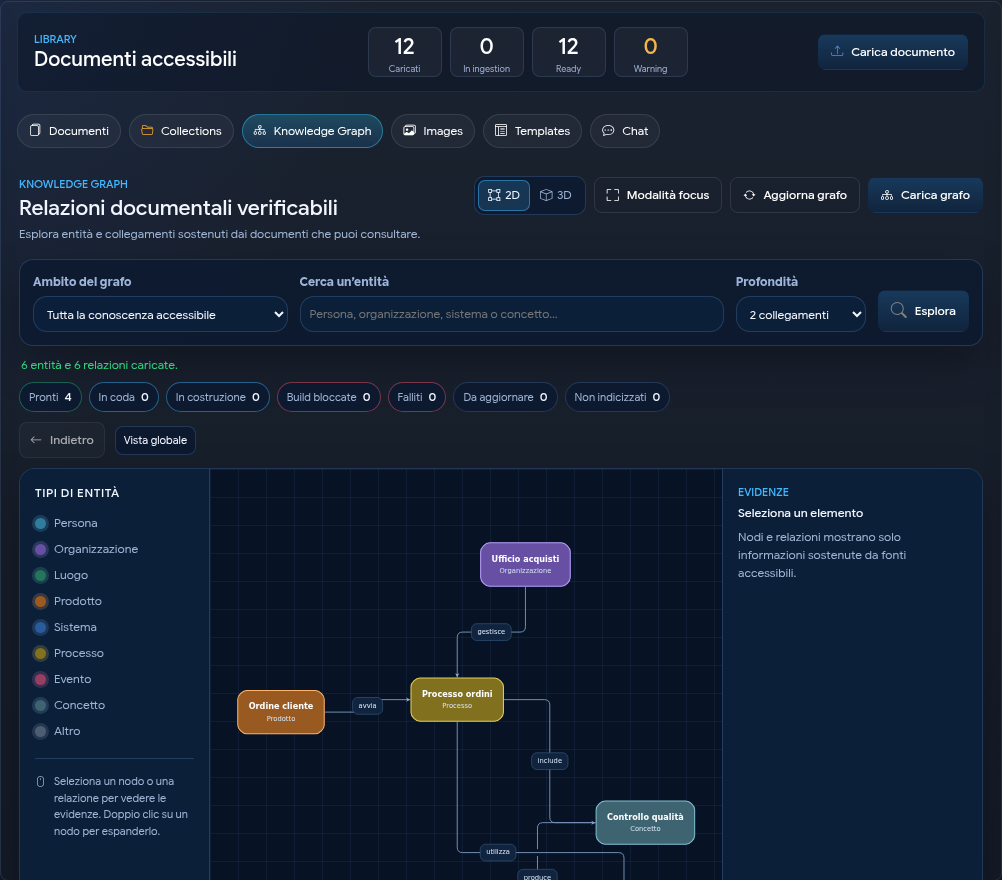
2. Load and explore the graph
- Open the Knowledge Graph tab.
- Choose the desired scope.
- If necessary, specify a person, organisation, system, product or concept in the Search for an entity field.
- Choose the depth of one or two connections.
- Select Explore.
Select a node or relationship to open the evidence panel. A double-click on a node uses it as a new starting point and shows its nearby connections.
The 2D view is the default. When the device supports WebGL 2 graphics, the selector above the diagram also enables the 3D view: drag to rotate, use zoom to move closer and further away, and select Center view to bring the entire graph back into the frame. Ctrl+scroll wheel applies progressive zoom. Selecting a node shows its relative label; after double-clicking and zooming in, labels for nearby nodes are also shown. Node and relationship selection, evidence and the exploration path are the same in both views. You can switch between 2D, 3D and focus mode multiple times without reloading the data. If 3D is unavailable or the graphics context breaks, LightHouse automatically maintains or restores 2D and shows a warning.
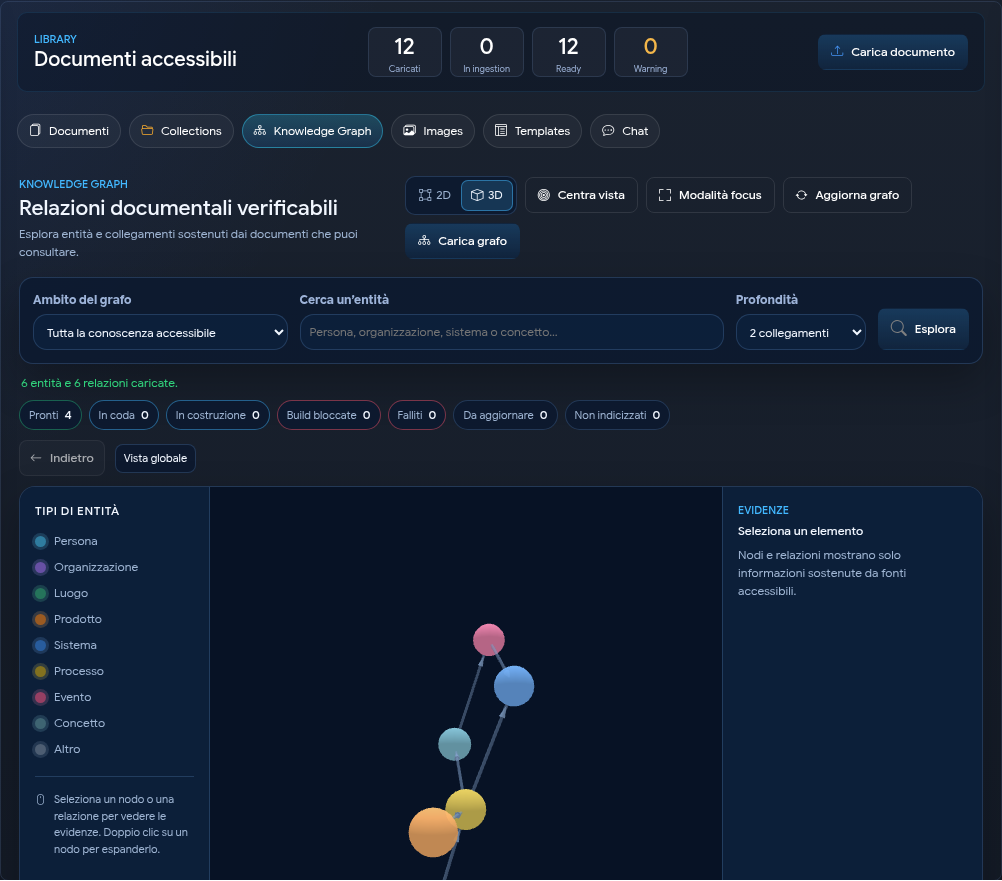
The path above the diagram retains the explored entities. Use Back or select a previous step to return from detail to the starting view. Focus mode stays within the browser tab, hides the page title, Library bars and side panels, and assigns the available space to the graph; the same command or the Esc key restores the normal view. Both views follow the selected light or dark theme.
The view applies a visual limit to keep the diagram readable. When the warning about the limited view appears, narrow the collection or search for a more specific entity.
3. Read nodes and relationships
The colour identifies the entity type, for example person, organisation, place, product, system, process, event or concept. The labelled lines describe the relationship detected between two nodes.
The side panel reports, when available:
- entity type and name or relationship predicate;
- extraction confidence;
- number of mentions or evidence;
- documents and passages supporting the connection;
- Download, to obtain the original file;
- View, to open the document without leaving the graph when the format is supported.
PDFs, images and text documents can be shown in the preview. Markdown files are rendered in the modal. Word, Excel, PowerPoint and major OpenDocument formats are prepared in the background as PDFs: the modal shows progress and automatically opens the result when ready. The pre-prepared preview is reused on subsequent openings.
If a conversion is unavailable or fails, it remains possible to download the original file; for other non-embeddable formats View is disabled.
Consult the document before using a relationship for a decision. A relationship with multiple evidence items indicates that multiple passages support it, not that it is automatically correct in every context.
4. Update the graph
Preparing the graph occurs in the background after document processing. Users with management permissions can select Update KG data to queue the analysis of missing or non-updated documents within the current scope. During processing, LightHouse updates counts and messages without reloading the diagram, so position, zoom, selection, and path remain unchanged.
Load graph serves a different purpose: it loads or reloads into the diagram the KG data already available for the current scope, search, and depth. It does not initiate document analysis. After an update, select it to view new nodes and relationships.
The status indicates how many documents are ready, queued, building, failed, blocked, or still not indexed. Periodic checks update only these indicators and can continue while using the graph; detailed progress for documents and chunks remains available in the collection panel.
The Graph scope menu shows only document collections. In the entity search field, the clear button empties the query and immediately restores the graph for the selected scope.
A ready document remains searchable even if its graph construction fails. In this case, diagnostics report the issue without hiding the document, and the update can be retried.
In the Documents tab, the Knowledge Graph column shows the status of each file. Selecting a row opens the details panel, which displays progress, counts, and a user-friendly message for any error. Retry build acts on the selected document only.
To prepare an entire collection, open the Collections tab and select the collection. In the details panel, the Knowledge Graph section shows percentage and progressive counts. Start full backfill queues all missing or updatable manageable documents; Rebuild graph regenerates even those already ready. Both operations continue in the background and do not require keeping the page open.
When other constructions are already in progress, LightHouse maintains the percentage for the selected collection and shows an animated bar with the status Queued for processing: the collection will start automatically. If no active construction appears for a few minutes, an explicit warning appears without losing the required work. A build that no longer updates its progress is marked as Blocked and can be restarted with Rebuild graph. If the issue persists, contact the administrator with the collection name and the displayed message.
Panel statuses, messages, and actions follow the language selected in the GUI.
5. Use in search
The Knowledge Graph is not just a view. Quick search, Document Chat, Sybot Light, and the LightHouse — Query Knowledge Base task can use it to reach steps connected to an entity or a relationship.
When the graph contributes, the interface shows the indicator Hybrid GraphRAG or Knowledge Graph used. The sources of the answer remain the original document chunks, always within the scope and user permissions.
6. If the graph is empty
Check that:
- the selected scope contains accessible documents in Ready status;
- no overly restrictive search term is active;
- the construction is not already queued or in progress;
- the documents contain explicit relationships supported by the text.
If you have management permissions, use Update KG data. In case of persistent failed status, contact the administrator with the affected scope and the message shown in the interface, without sharing confidential content.