Activities - Health and operational metrics
The Activities page provides a concise overview of workflow execution trends. It is useful for quickly identifying anomalies, comparing outcomes over time, and pinpointing workflows that require attention.
To analyse a single execution in detail, go to the Logs page.
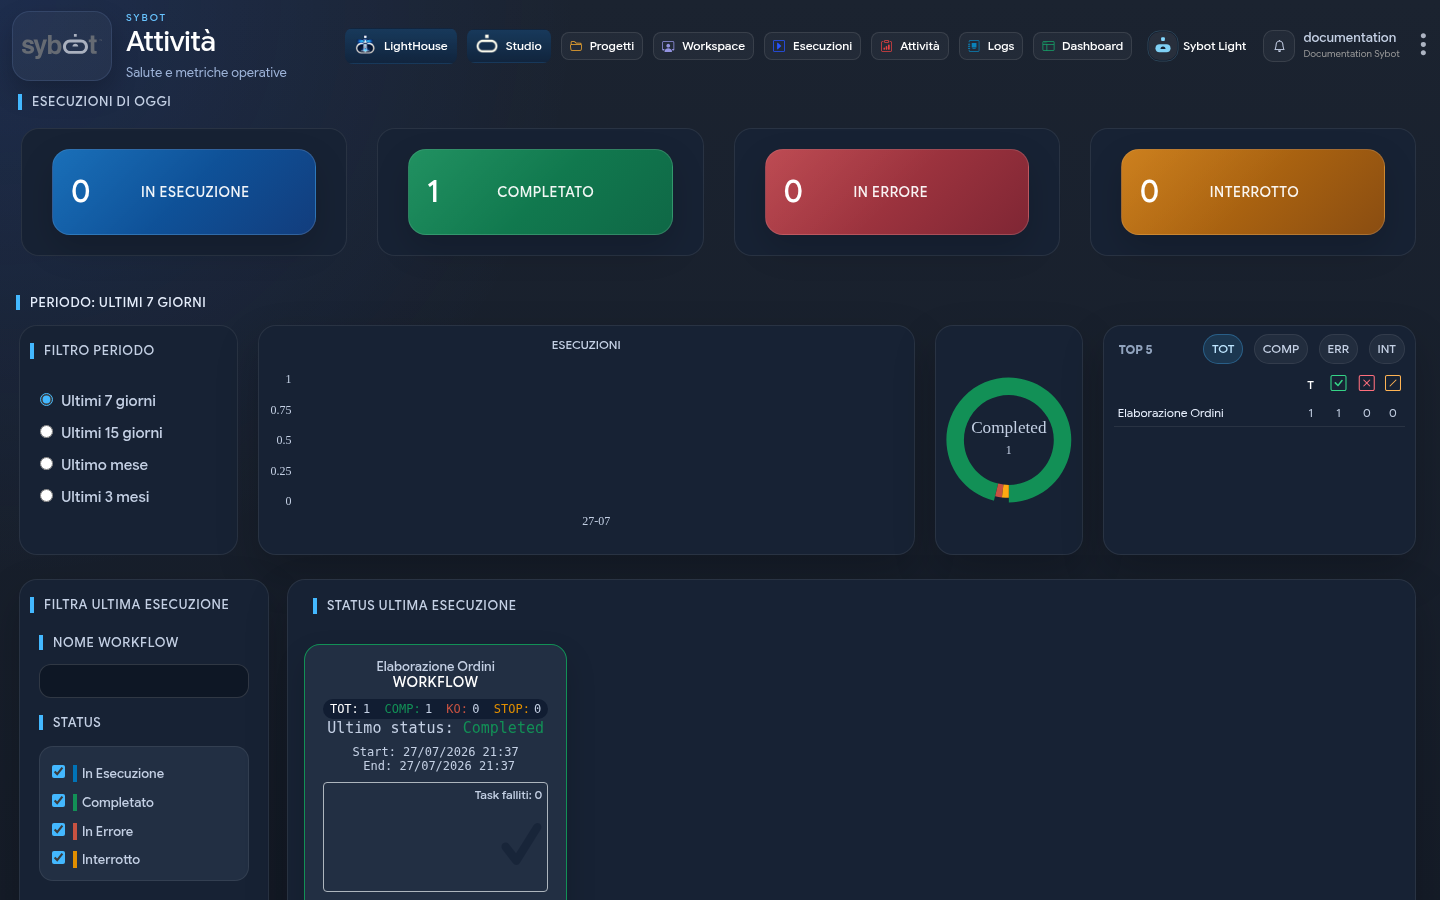
1. Today's executions
The indicators at the top summarise the executions recorded on the current day:
| Indicator | Meaning |
|---|---|
| Running | Executions still active. |
| Completed | Executions concluded successfully. |
| Failed | Executions concluded with an error. |
| Stopped | Executions halted before completion, for example via the Stop action. |
Daily indicators are independent of the period selected for the charts below.
2. Period analysis
The Period filter updates charts, state distribution, and rankings. Available options are:
- Last 7 days
- Last 15 days
- Last month
- Last 3 months
2.1 Execution trends
The EXECUTIONS chart shows how executions vary over time:
- completed;
- failed;
- stopped.
A sudden increase in errors or interruptions may indicate a common issue affecting multiple workflows or a recent change that needs verification.
2.2 State distribution
The ring chart compares the relative weight of different outcomes in the selected period. This view allows you to quickly distinguish an occasional issue from a recurring trend.
2.3 Top 5 workflows
The TOP 5 section ranks workflows according to the selected tab:
| Tab | Sorting |
|---|---|
| TOT | Highest total number of executions. |
| COMP | Highest number of completed executions. |
| ERR | Highest number of failed executions. |
| INT | Highest number of stopped executions. |
For each workflow, the total, completed, failed, and stopped counts are still visible.
3. Search and filters
The Filter last execution section acts on the cards shown in Last execution status.
You can:
- search by workflow name;
- include or exclude states Running, Completed, Failed, and Stopped;
- limit results to one or more categories.
Filters are combinable. If an expected workflow does not appear, verify that its state and category are still selected.
4. Last execution status
Each card represents a workflow and summarises the activity recorded in the period:
- object name and type;
- total number of executions;
- number of completed, failed, and stopped executions;
- status of the most recent execution;
- start and end date and time of the last execution;
- number of failed tasks;
- details of any failed tasks.
An execution still active may not have an end date. Card data is updated without needing to manually reload the entire page.
5. How to use the page
A typical operational check can follow this sequence:
- verify the Failed and Stopped indicators for the day;
- select a period consistent with the analysis;
- use the ERR and INT tabs to identify the most involved workflows;
- filter cards by state or category;
- open the Logs page to examine timelines, tasks, and any execution messages.
Comparing a short period with a wider one helps determine whether an anomaly is recent or recurring.